ScaleCurve is a class that stores results of scaleCurve function.
Details
ScaleCurve intherits behviour from numeric vector, so raw values of ScaleCurve can be accessed via as.numeric(...).
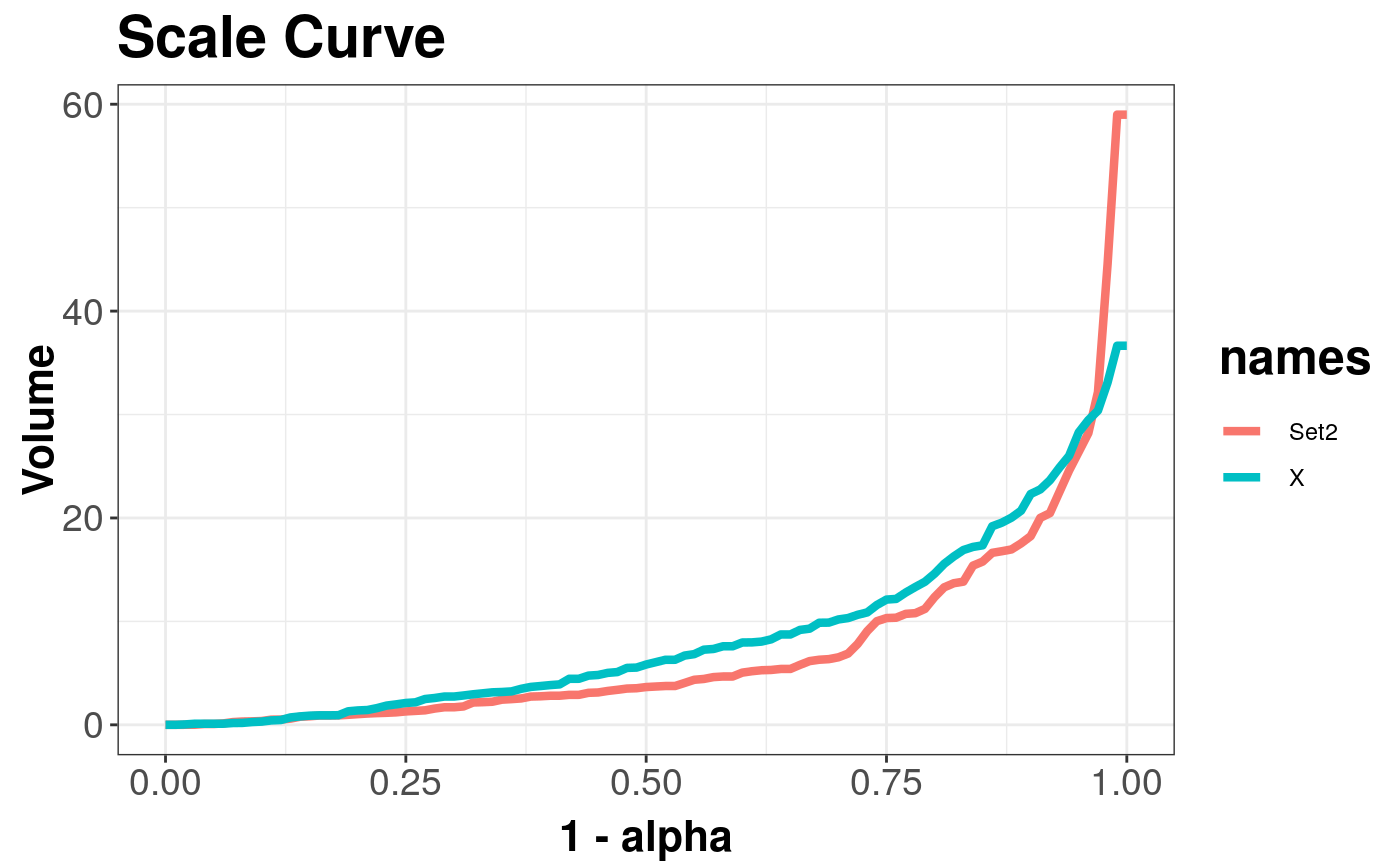
The mechanism of creating plots with multiple curves is shown in DepthCurve-class (same mechanism is applied for AsymmetryCurve).
Examples
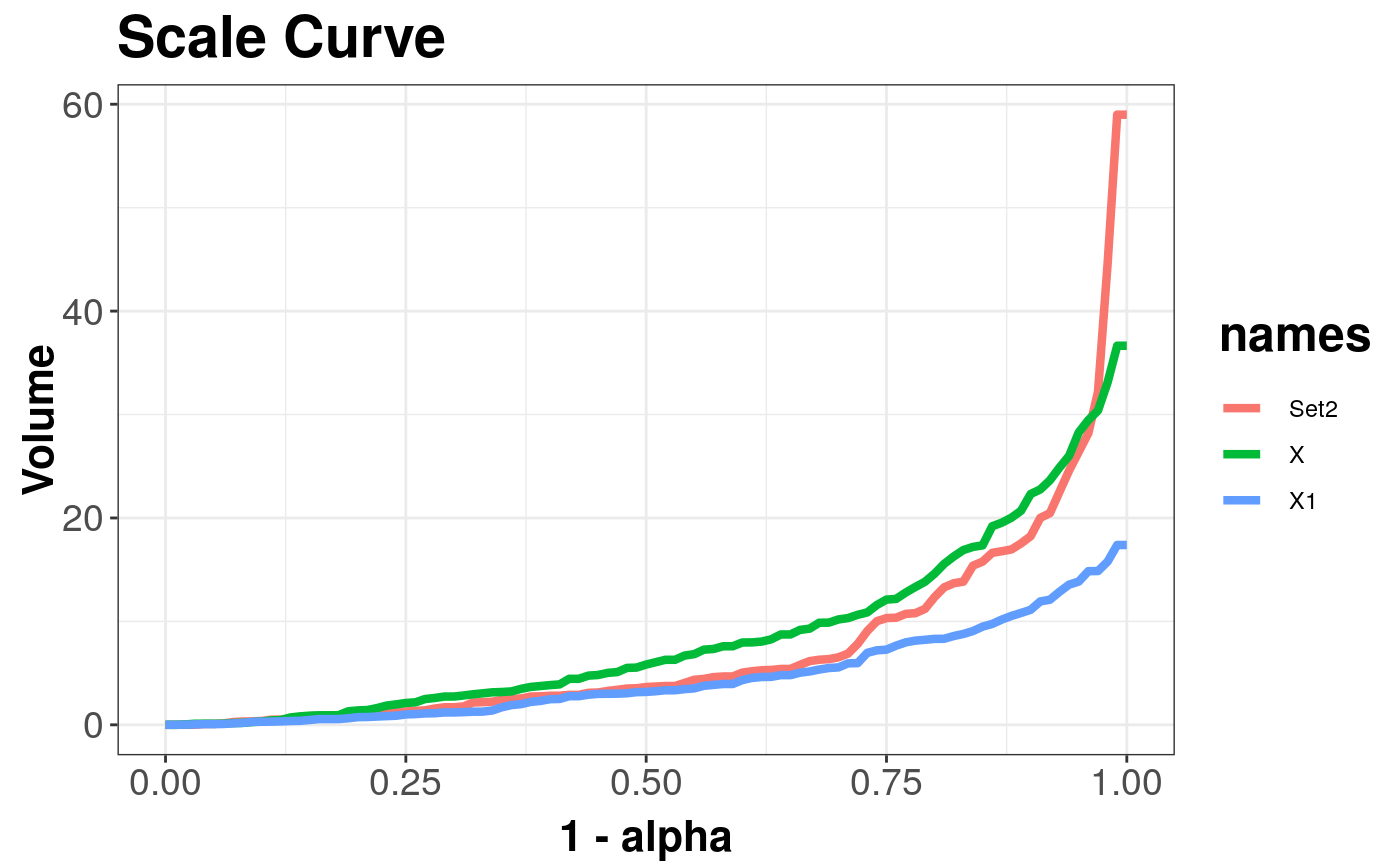
library(mvtnorm) x <- mvrnorm(n = 100, mu = c(0, 0), Sigma = 2 * diag(2)) y <- rmvt(n = 100, sigma = diag(2), df = 4) s1 <- scaleCurve(x, depth_params = list(method = "Projection")) s2 <- scaleCurve(y, depth_params = list(method = "Projection"), name = "Set2") sc_list <- combineDepthCurves(s1, s2) # Add one curve to another plot(sc_list) # Draw plot with two curvesz <- mvrnorm(n = 100, mu = c(0, 0), Sigma = 1 * diag(2)) s3 <- scaleCurve(z, depth_params = list(method = "Projection")) plot(combineDepthCurves(sc_list, s3)) # Add third curve and draw a plot#> Warning: Names in DepthCurveList are not unique!